HomeServerBlog fiber transceiver worksheet
Transceiver Power Budget Calculator
Estimate whether an SFP, SFP+, SFP28, QSFP, or QSFP28 optical path has enough receive margin without driving the far-end receiver into overload.
⚙Optic presets
📝Transceiver and fiber inputs
Budget breakdown
Pass status
📊Live planning snapshot
Uses the lowest transmitter launch value.
Uses the highest transmitter launch value.
Received minimum above sensitivity.
Connectors, splices, and mux before fiber.
🖧SFP/QSFP comparison grid
📚Transceiver reference tables
Common transceiver preset table
| Preset | Form factor | Typical wavelength | Planning reach |
|---|---|---|---|
| 1G SX | SFP | 850 nm multimode | 220-550 m depending on OM grade |
| 1G LX | SFP | 1310 nm single-mode | 10 km campus or building fiber |
| 10G SR | SFP+ | 850 nm multimode | 300 m on OM3, 400 m on OM4 |
| 10G LR | SFP+ | 1310 nm single-mode | 10 km with normal patching |
| 10G ER | SFP+ | 1550 nm single-mode | 40 km class, often attenuation-limited |
| 25G SR | SFP28 | 850 nm multimode | 70-100 m depending on OM grade |
| 25G LR | SFP28 | 1310 nm single-mode | 10 km access or top-of-rack |
| 40G SR4 | QSFP+ | 850 nm parallel multimode | 100-150 m with MPO trunks |
| 100G LR4 | QSFP28 | 1310 nm LAN-WDM | 10 km duplex single-mode |
| 100G CWDM4 | QSFP28 | 1271-1331 nm CWDM | 2 km data-center interconnect |
Transceiver receiver window table
| Optic family | Tx planning range | Rx sensitivity example | Overload check |
|---|---|---|---|
| SFP SX/LX | -9.5 to -3 dBm is common for SX planning | Use the rated minimum receive power | Short single-mode jumpers can be too hot with LX optics |
| SFP+ SR/LR | SR is often negative dBm; LR may launch near 0 dBm | Budget changes by vendor and coding | Loopback tests need an attenuator if received max exceeds overload |
| SFP28 25G | Higher lane rate usually leaves less margin | Check whether FEC is required for the datasheet value | Use switch DOM receive power as a sanity check |
| QSFP parallel | Loss applies per lane through MPO trunks | Worst lane decides the usable link | Inspect polarity and lane mapping before blaming budget |
| QSFP WDM | Duplex LC optics combine several wavelengths | Datasheet sensitivity may include lane-level assumptions | Keep mux and cassette loss in the fixed-loss field |
Fiber plant loss allowances
| Plant item | Typical clean value | Conservative value | Where it appears |
|---|---|---|---|
| LC or SC mated pair | 0.2-0.35 dB | 0.5 dB | Connector count field |
| MPO mated pair | 0.35-0.6 dB | 0.75 dB | Connector count or mux loss |
| Fusion splice | 0.02-0.05 dB | 0.1 dB | Splice count field |
| Patch panel cassette | 0.35-1.0 dB | 1.5 dB | Mux, patch, tap, or splitter loss |
| CWDM/DWDM mux | 1.0-3.5 dB | Vendor value | Mux, patch, tap, or splitter loss |
| Optical tap | 3-10 dB | Marked ratio | Mux, patch, tap, or splitter loss |
Fiber attenuation planning table
| Fiber and wavelength | Planning attenuation | Best fit | Calculation note |
|---|---|---|---|
| OM3/OM4 at 850 nm | 2.5-3.5 dB/km | SR optics inside racks and rows | Distance limit is often modal bandwidth, not only loss |
| Single-mode at 1310 nm | 0.32-0.40 dB/km | LR, CWDM4, LR4 short campus links | Use 0.35 dB/km for a conservative worksheet |
| Single-mode at 1550 nm | 0.20-0.25 dB/km | ER, ZR, and amplified spans | Long spans may need dispersion checks too |
| Older installed fiber | Measure with light source | Unknown patch panels and mixed trunks | Measured loss should replace guessed attenuation |
💡Practical tips
Sometimes we think of a connected fiber optic cable as just a simple yes/no: it’s working; or it isn’t. In truth, there are many complicated optical and electrical processes taking place behind physical connection. There’s a transmitter that sends out light and a receiver trying to detect it. And it has to do so against background noise.
Too little light, and the receiver will make error. Too much light, and the receiver will get saturated. That’s where optical engineering comes into play, how do you find the sweet spot between these two?
How Fiber Optic Signals Work
So many folks think it’s just about distance. “The cable has to be less than X feet because then it’ll work.” That leaves out half of the equation. It also takes into account power budget, which is range of what the receiver can receive versus what the transmitter puts out.
Yes there are calculators that do all the math for you. But knowing what the numbers mean matters too. In other words, how much is still left at the end of the cable? Is it bright enough to read? The calculator figures that out by taking into account all the things that reduces the signal strength from transmitter to receiver.
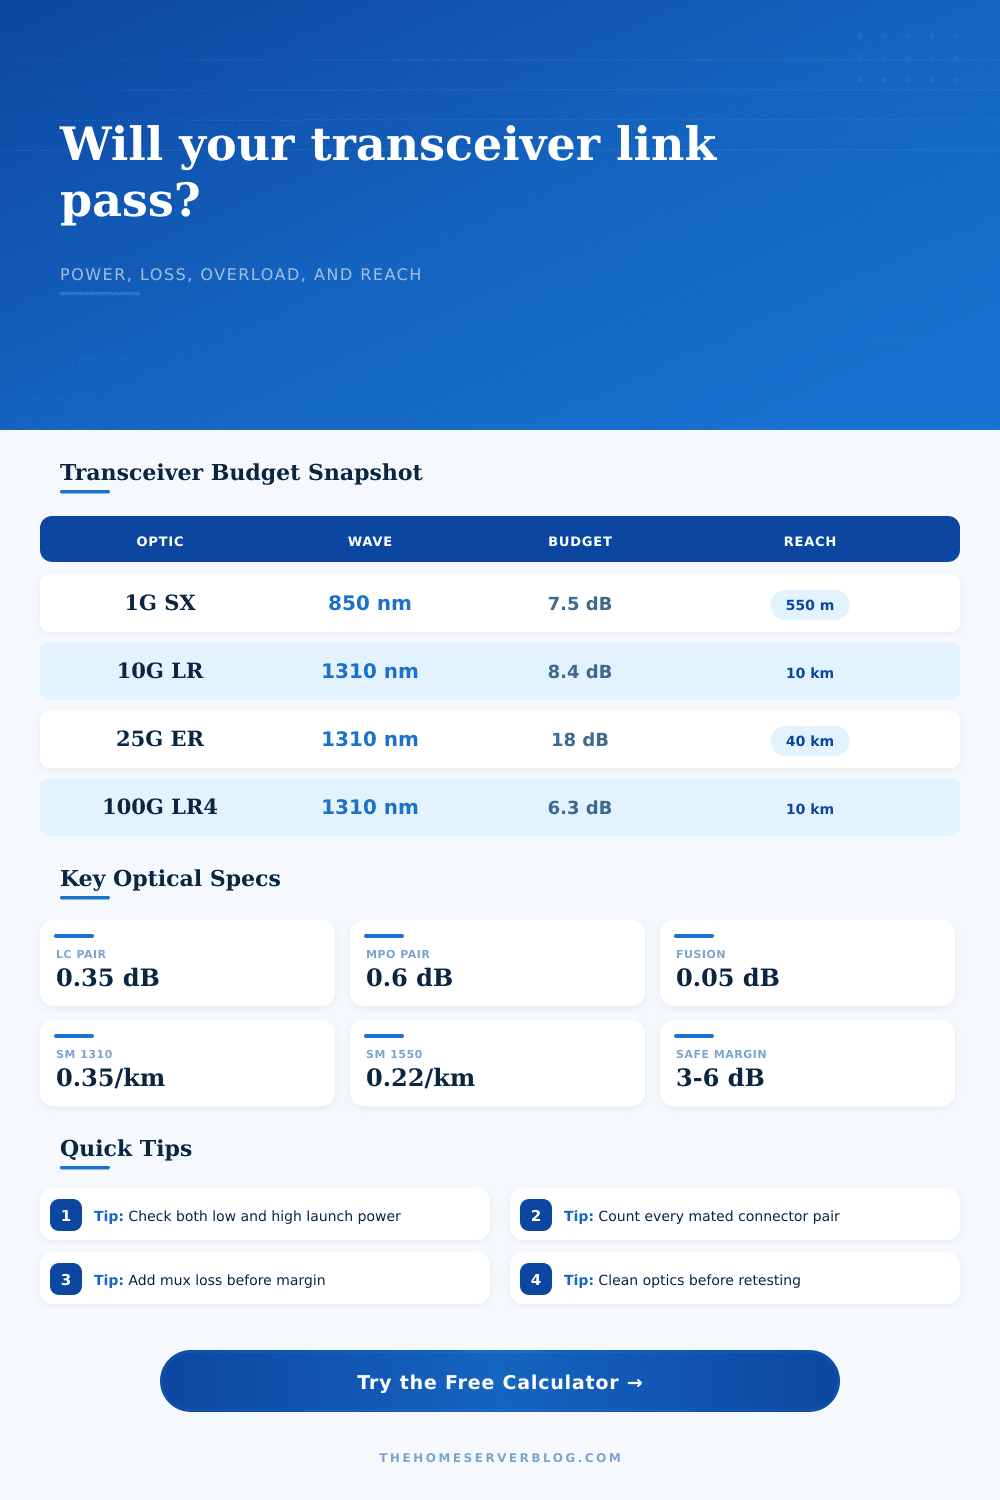
As light travels down the fiber it will become weaker resulting in a loss of the light. This happens with splices and connectors too. Insertion loss is small decrease in signal when two connector mate. Small losses accumulate fast. For example, a tenth of a decibel may be lost per clean LC connector. You can see that a lot more loss can occur if there is dirt on your connector. If your link isn’t functioning, cleaning your optics is critical.
The tool provide standard values for loss without having to guess it based off the reference tables. On the other hand, they may be getting too much power. High-power transmitters on short links will overdrive receivers. More isn’t necessarily more. There’s a limit to photodiode handling. Too much signal cause clipping and increased errors.
The calculator compares the max transmit power to the max input rating for the receiver. It gives you a number called overload clearance. That tells you how much margin you have to go before your sensor is blinded from too much light.
The other useful idea here is design margin. In a hobby project, people ignore it. But in a commercial setting, it’s critical. Temperature change and component aging should of some sort of cushion. A little bit of margin in decibels guarantees that even as the equipment degrades over time, the link remain operational.
This margin is something you specify yourself with tool. How aggressive or conservative do you want to be given your particular circumstances? The datasheets are always perfect, right? No, not always. Your environment will introduce other variables that don’t show up on a datasheet. For example, you may have mixed fiber grades, poorly made patch panels, and/or bending around corners where you lose signal quality (bend loss).
The preset buttons in this calculator use typical industry values for popular transceivers across all ranges from long-range single-mode to short-range multimode. If possible, however, double-check those values against real world data for the specific pieces of gear you’re using.
Both ends of the spectrum need to be considered when setting up a healthy fiber link… Low and high power levels. We want a speedy data transfer, yes, but we also want the signal level to remain constant. That’s as true in a data center backbone as it is in a home lab.
Be careful with your measurements. Count all connections. Add some cushion so you know it will hold together.