HomeServerBlog UPS power loss planner
UPS Efficiency Loss Calculator
Estimate UPS input watts, protected output watts, inverter loss, charger overhead, heat output, bypass savings, redundancy loading, runtime load, and capacity margin for home labs and small equipment rooms.
Efficiency loss breakdown
Capacity and redundancy check
Modeled UPS loss converted into the selected heat view.
Estimated watt difference between normal and bypass paths.
Output load carried by each active UPS module or path.
Battery-mode load as a share of the modeled UPS rating.
| Topology | Typical efficiency | Best load band | Loss behavior |
|---|---|---|---|
| Standby | 96% to 99% | 20% to 70% | Very low conversion loss during normal utility operation. |
| Line interactive | 94% to 98% | 30% to 80% | Good home lab default when utility quality is stable. |
| Online | 90% to 96% | 35% to 75% | Heat remains visible even at moderate loads. |
| Eco mode | 97% to 99% | 25% to 80% | Lower loss when bypass path is qualified. |
| Transformer | 88% to 94% | 45% to 85% | Fixed magnetizing loss can hurt light-load efficiency. |
| Load percent | Efficiency pattern | Thermal note | Planning action |
|---|---|---|---|
| Below 20% | Often below peak | Fixed overhead dominates. | Consolidate load or use a smaller UPS where appropriate. |
| 20% to 40% | Improving | Moderate heat for most line interactive units. | Good for low-noise home lab reserve. |
| 40% to 70% | Usually best | Strong balance of loss and headroom. | Common target for always-on UPS sizing. |
| 70% to 90% | Still useful | Less capacity margin and more battery stress. | Check startup peaks and battery runtime requirements. |
| Above 90% | Tight | Little room for charger or load spikes. | Reduce load or increase UPS capacity. |
| Loss watts | BTU/hr | kW heat | CFM at 20°F |
|---|---|---|---|
| 25 W | 85 BTU/hr | 0.025 kW | 4 CFM |
| 50 W | 171 BTU/hr | 0.050 kW | 8 CFM |
| 100 W | 341 BTU/hr | 0.100 kW | 16 CFM |
| 250 W | 853 BTU/hr | 0.250 kW | 39 CFM |
| 500 W | 1,706 BTU/hr | 0.500 kW | 79 CFM |
| Configuration | What to model | Margin concern | Efficiency concern |
|---|---|---|---|
| Single UPS | One unit carries all output load. | Reserve must cover future load and recharge. | Choose a rating that avoids very light loading. |
| Dual A/B | Normal load split across two UPS paths. | Each side may need to carry all load on failover. | Light loading can lower each unit efficiency. |
| N+1 parallel | Load divided by active modules. | One module can be lost without overload. | Extra modules add some fixed overhead. |
| Maintenance bypass | Compare inverter path with bypass path. | Protection and conditioning are reduced in bypass. | Useful for estimating heat during service windows. |
You purchased your UPS to run your lights if there’s a blackout. You read up on the surge capacity and looked at the battery runtime. You plugged it into the wall and promptly forgot all about it.
Then, on a summer afternoon, you notice your little server room has turned into a sauna in July. The heat isn’t mysterious. It’s a cost of protection. Each watt lost from the wall outlet to your server rack translates 1:1 to heat. Knowing what this loss look like is the difference between staying stable and facing a thermal crisis.
Why Your UPS Makes Heat
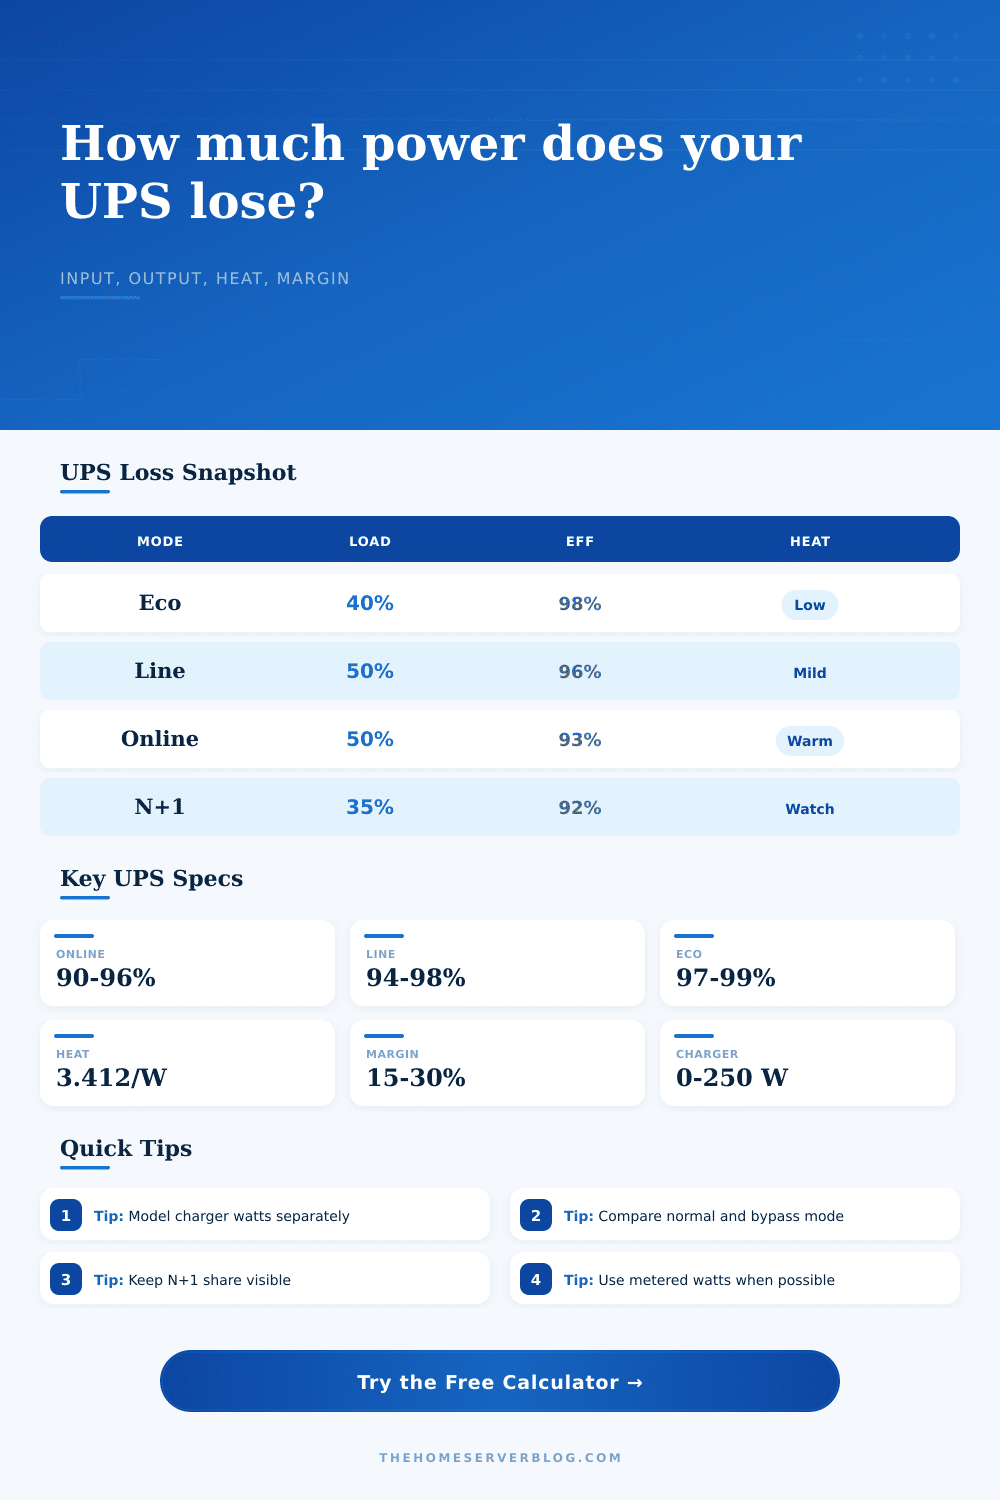
The efficiency is not one magic number printed on the box that everyone assumes it is. The datasheet say 96 percent efficient, great! But then you read further and discover this is typicaly only true at some load level like 50 or even 70 percent. Will you drop below this if a switch and a router only has a 20 percent load? Then your efficiency will be much lower than expected. The transformer still have its own losses from magnetizing current. All the control circuitry and fans inside also has their fixed overhead.
Plug in your real world watts of load and the calculator does the rest (no more guesses about how far up or down that efficiency curve your particular device sits).
The type of topology determines basic heat output. Online (double-conversion) devices is always converting AC to DC and back, which is both robust and lossy; they offer pristine power quality but generate some additional heat, particularly when lightly loaded. For steady input power, the line-interactive design avoids constant conversion during normal use (relying on taps or caps to tweak voltage). It runs cooler but provides lesser isolation from line noise. If you have reliable utility power, the line-interactive model may save you enough cooling costs to compensate for the lesser level of protection offered.
The chart on that page makes this clear; you see that transformer-based designs drop off sharply in efficiency as load decreases.
The other cost, not accounted for in many efficiency estimates is the battery charger. The charger consume quite a bit of power either while running normally (float charge) or after an outage. It’s going to be drawing power and adding directly to your heat in the room.
When modeling your system if you have only one UPS the total consumption will show up. But if you are using an N+1 redundant configuration, you need to remember that both units is consuming power even when they are each doing half the job. The second unit is there for peace of mind but it adds to the thermal load as well. You can’t split the loss in half.
There’s an escape hatch: Bypass modes. On demand, the UPS will divert power right past the inverter, either into static bypass mode (no conversion at all) or eco mode, where some conversion occurs, but the load is much lighter. The room temperature drop instantly, and energy loss from conversion is greatly reduced.
The catch? There is less power conditioning. Voltage regulation, filtering, what makes online UPSes desirable in the first place, are lost. Some people switch to bypass when they’re performing maintenance and want to avoid extra heat stress, but doing so leaves them without protection against transient spikes. With the calculator, you can see a side-by-side comparison of these modes and figure out how many watts you’re saving with the direct connection.
The size is important. How many times has someone said “I need a small UPS”, but they are plugging it into a huge computer? It’s not efficient. Fixed losses will dominate when a massive UPS protect a tiny load. The variable losses don’t matter much when they’re such a small fraction of the whole load. But if you put a UPS that’s only 95% loaded, there’s nowhere for it to surge during startup, and nothing to draw from while it recharges batteries. That close margin mean trouble.
You would of wanted it to operate in the sweet spot with good efficiency and some headroom for potential growth.
So all of this adds up to what? Thermal management, runtime, and power quality must be balanced. Model your output load versus your input draw so that you know if your cooling infrastructure will be able to cope with the waste heat produced by your backup power system. That transforms an invisible cost into a variable you can manage.
You don’t just want to survive the outage; you also want to stay cool until it ends.