HomeServerBlog capacity planning tool
Utilization Headroom Calculator
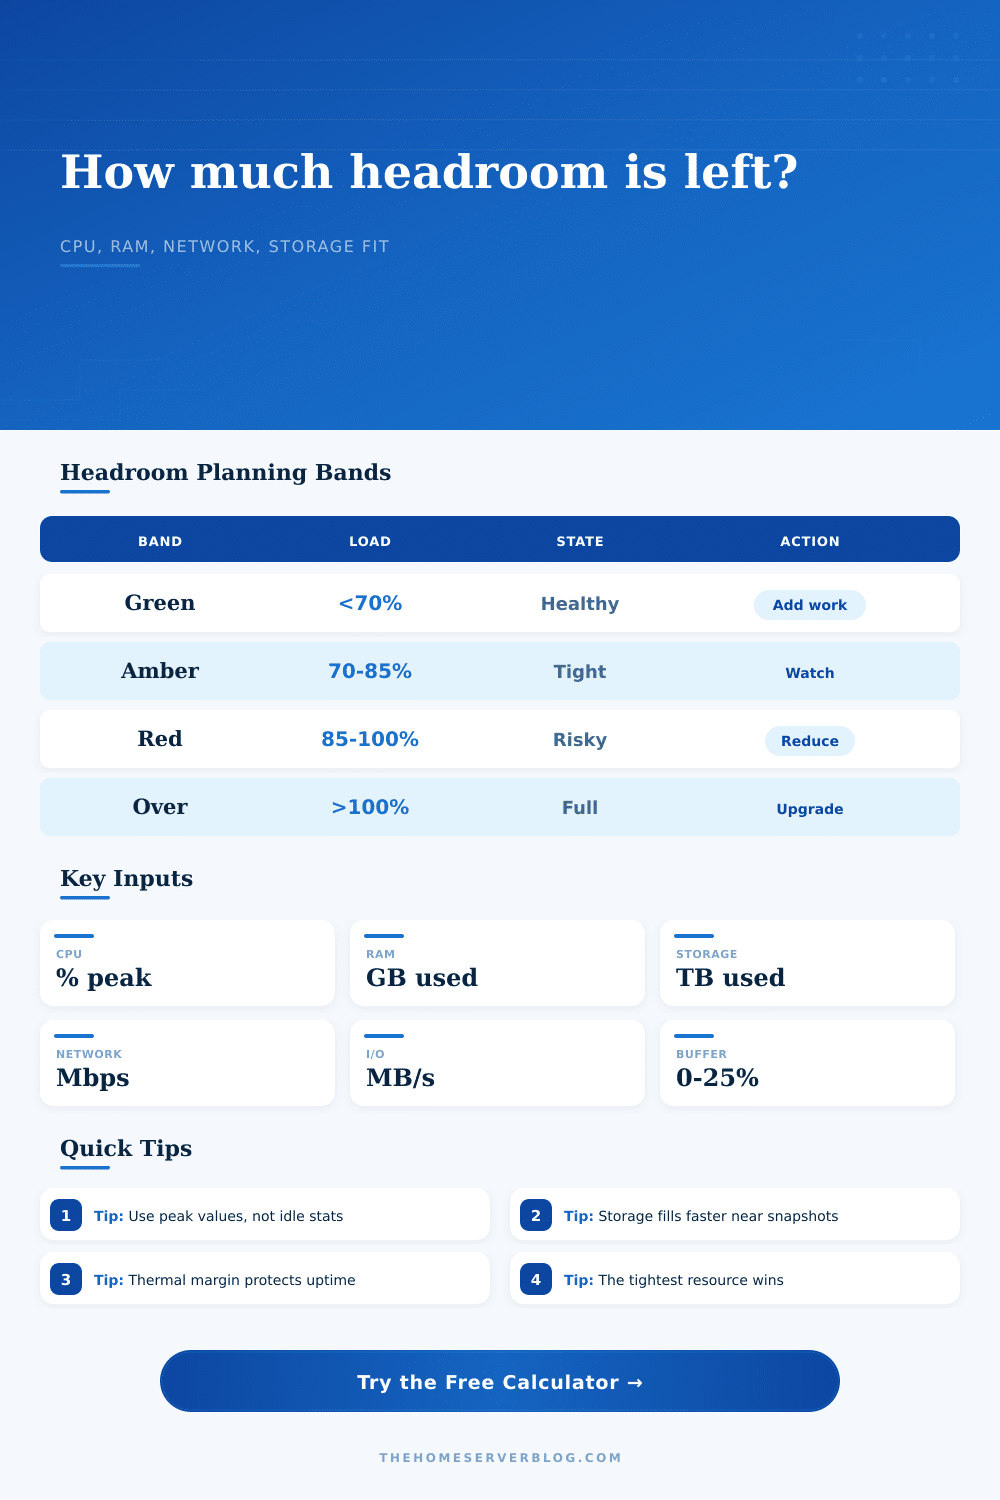
Estimate whether a home server, NAS, firewall, virtualization node, or lab cluster has enough spare CPU, memory, storage, disk I/O, network, power, and thermal capacity for growth without crossing your utilization target.
▣Home lab headroom presets
⚙Resource utilization inputs
Calculation breakdown
Resource pressure map
🖧Equipment and platform comparison grid
📊Reference tables
Utilization bands by resource
| Resource | Healthy band | Tight band | Why it matters |
|---|---|---|---|
| CPU peak | Below 70% | 70% to 85% | Bursts, encryption, compression, and updates need scheduler room. |
| Memory used | Below 75% | 75% to 90% | Low RAM causes swapping, ARC shrinkage, and slow VM pressure. |
| Storage pool | Below 75% | 75% to 85% | ZFS, snapshots, and SSDs usually behave worse as free space disappears. |
| Disk I/O | Below 65% | 65% to 85% | Latency rises before raw throughput hits the absolute maximum. |
| Network | Below 70% | 70% to 90% | Protocol overhead, retransmits, and backups make links feel full early. |
| Power and heat | Below 80% | 80% to 95% | UPS runtime, PSU efficiency, and cooling noise all worsen near the top. |
Platform capacity assumptions
| Platform | CPU index | Network | Thermal envelope |
|---|---|---|---|
| N100 mini PC | 100 | 940 Mbps | 35 W continuous planning |
| Ryzen mini PC | 260 | 2350 Mbps | 90 W continuous planning |
| 4-bay NAS appliance | 130 | 2350 Mbps | 85 W continuous planning |
| 8-bay NAS or tower | 260 | 9400 Mbps | 180 W continuous planning |
| Xeon tower server | 420 | 9400 Mbps | 320 W continuous planning |
| EPYC lab node | 900 | 23500 Mbps | 500 W continuous planning |
| Firewall appliance | 110 | 2350 Mbps | 45 W continuous planning |
| GPU workstation server | 520 | 9400 Mbps | 700 W continuous planning |
Workload multipliers
| Configuration | CPU burst | Storage factor | Typical bottleneck |
|---|---|---|---|
| Mixed services | 1.12x | 1.05x | RAM or single-core CPU bursts |
| Virtualization | 1.25x | 1.10x | RAM reservations and datastore latency |
| NAS and media | 1.08x | 1.18x | Pool fullness, snapshots, and HDD I/O |
| Network edge | 1.35x | 1.02x | VPN, IDS, packet inspection, and uplink speed |
| Cluster node | 1.20x | 1.12x | Failover capacity and replicated storage |
| Compute node | 1.30x | 1.04x | Thermal limit, CPU/GPU power, and memory |
Common home server project sizes
| Project | Normal resources | Headroom trigger | Planning note |
|---|---|---|---|
| Reverse proxy and apps | Low CPU, low storage | RAM and database growth | Reserve memory for logs, TLS, and update spikes. |
| Proxmox VM host | Medium CPU, high RAM | RAM reservations | Do not count ballooned memory as always-free capacity. |
| Media NAS | Medium I/O, high storage | Pool above 80% | Snapshots and thumbnails quietly consume free space. |
| NVR and cameras | Steady writes, steady network | I/O latency | Continuous writes need more disk margin than bursty file shares. |
| Firewall with VPN | Packet CPU and network | Encrypted throughput | VPN and IDS loads are CPU-sensitive even on fast ports. |
| Kubernetes lab | RAM, CPU, image storage | Node drain reserve | Keep spare room for reschedules and failed-node testing. |
💡Planning tips
This calculator is a planning model. Validate final changes with actual monitoring from your hypervisor, NAS, firewall, UPS, and temperature sensors before treating a node as production-ready.
When your home server reaches a breaking point, you’ll notice things like video starting to buffer and files taking forever to transfer. But this isn’t a problem with the hardware, the server is simply full. The problem is that the hardware are full. The total terabytes of storage and gigabytes of RAM aren’t as important than their utilization headroom. What you purchased doesn’t matter, what’s left after accounting for your workloads does.
Plugging in your existing usage, the calculator above do all the math for you. You won’t have to fudge safety margins or try to guess a burst coefficient. Instead it measures what you’re actualy doing against what your platform is physically capable of. Then it factors in how fast you’re growing and then puts a nice fat safety buffer on top of that. And it lets you know if you’ve got enough room for an additional service… Or if you’re already pushing too hard and starting to degrade performance.
Why You Need Free Space on Your Server
The key here is to examine your peak instead of your average. Your average CPU use mask your actual latency-causing spikes. A transcode of some media begins. A virtual machine awakens. A backup job kicks off at the same time. Now the system feel it all together. So the tool requests a peak because that defines your effective capacity. Maybe you’re an average of twenty percent, but when you hit eighty during peak, then eighty is what matters. Not the twenty; that’s the margin that allows you to do everything without issue.
Memory behaves different than CPU because it does not release resources as quickly. The RAM used by a virtual machine reservation, or a database cache, won’t return to the pool unless explicitly instructed to do so. Services which aggressively cache data will use more memory than you think; so, your free memory count will be misleadingly low.
Likewise, storage is also weird. File systems (such as ZFS) perform very poorly when they’re filling up. Metadata overhead and snapshots will quietly consume free space. Don’t assume that just because you see seventy percent of your drive free, its usable performance margin is anywhere near as high. That’s laid out in the reference table on the page, with clear bands for each type of resource.
For example, it points out that network links (and disk I/O) frequently maxes out long before reaching their theoretical max. Latency rises before throughput caps out. Bandwidth will be consumed by protocol overhead and retransmission that don’t show up in simple speed tests. Knowing those hidden costs helps you avoid buying a more expensive network card, only to find that the real slowdown was caused by disk write latency or CPU encryption overhead.
Most projects fail due to growth planning. Sure, it’s simple enough to add another database or camera stream at any given point. But anticipating the impact on the remaining stack is more difficult. The calculator lets you specify a horizon (planning period) and percentage of growth that you expect. From there it projects out your load into the future. Then it tells you when you’re projected to reach your target utilization limit. When that number becomes less than your comfort level, it’s time for hardware expansion. Before the next software update cycle or holiday traffic spike.
It’s easy to ignore thermal and power limitations until you don’t. If your server is overheating, it’ll slow down its CPU frequency to keep cool. That causes a feedback loop: lower performance = longer jobs. This means the CPU have more time to run. Make sure you check that your servers aren’t exceeding your PSU and UPS capacity (don’t let electricity be your biggest constraint).
It’s the weakest link: “You may be running low on a certain type of resource, such as network bandwidth, even though you have ample amounts of other resources, e.g. You might have free disk storage. The key is to find the line closest to red and fix that specific limit so you do not unnecessarily upgrade in other areas.
Having headroom isn’t simply about having ‘space’. It’s about having the appropriate kind of ‘space’, where you need it most.
This was posted by Server Density (@serverdensity) on September 15, 2016.