VLAN Trunk Overhead Calculator
Estimate 802.1Q tag overhead, total wire-rate load, payload efficiency, and MTU headroom before you change a trunk link.
Full Breakdown
| Component | Bytes | Applies To | Calculator Treatment |
|---|---|---|---|
| Destination and source MAC | 12 | Every Ethernet frame | Included in wire-rate overhead |
| EtherType or length field | 2 | Every Ethernet frame | Included in wire-rate overhead |
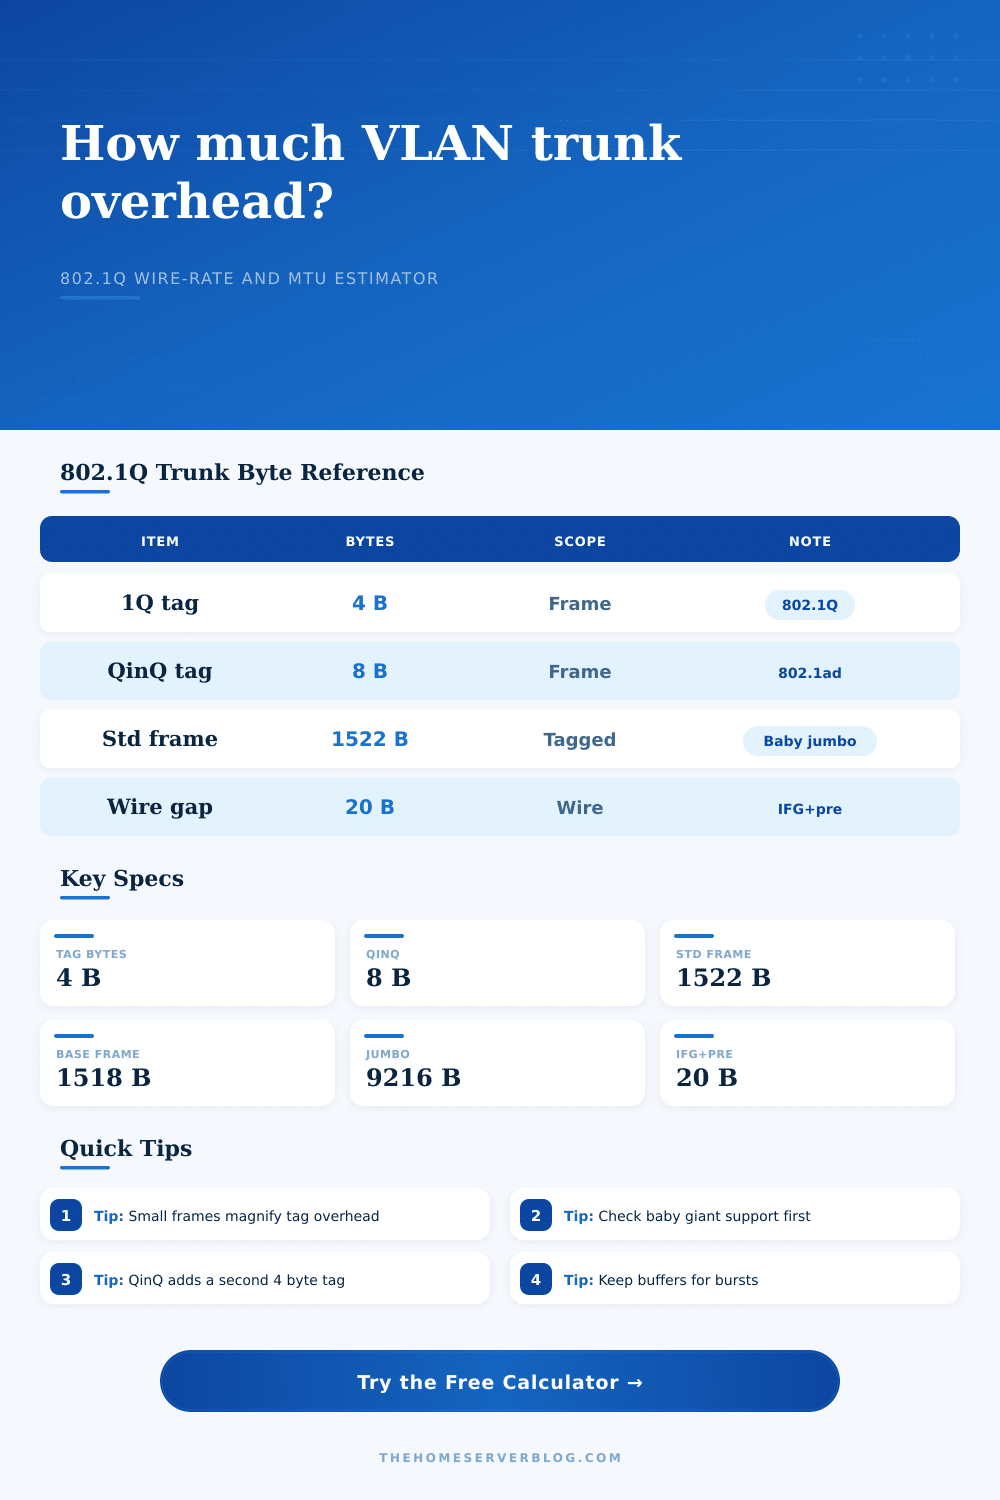
| 802.1Q VLAN tag | 4 | Tagged frames | Counted by tagged traffic percentage |
| 802.1ad QinQ double tagging | 8 | Provider or nested lab trunks | Counts an extra 4 bytes over normal 802.1Q |
| Frame check sequence | 4 | Every Ethernet frame | Included in wire-rate overhead |
| Preamble, SFD, and inter-frame gap | 20 | Physical wire timing | Included so utilization matches line-rate planning |
| Frame Limit | Best Fit | Single 802.1Q Payload | QinQ Payload |
|---|---|---|---|
| 1518 bytes | Legacy untagged Ethernet | 1496 bytes before FCS limit | 1492 bytes before FCS limit |
| 1522 bytes | Standard 802.1Q trunks | 1500 bytes without shrinking MTU | 1496 bytes if double tagged |
| 1526 bytes | QinQ baby giant support | 1504 bytes with one tag | 1500 bytes with two tags |
| 9000 bytes | Jumbo storage VLANs | 8978 bytes with one tag | 8974 bytes with two tags |
| 9216 bytes | Common data center jumbo limit | 9194 bytes with one tag | 9190 bytes with two tags |
| Scenario | Link | Tagged Share | Planning Note |
|---|---|---|---|
| Router-on-stick firewall | 1G or 2.5G | 100% | Every inter-VLAN flow crosses the same trunk twice when routed out and back. |
| Hypervisor host trunk | 10G | 90% to 100% | Management, storage, VM, and migration VLANs often share one NIC team. |
| Multi-SSID access point | 1G to 2.5G | 70% to 100% | Guest, IoT, staff, and trusted SSIDs usually map to separate VLANs. |
| NAS or backup VLAN trunk | 10G or 25G | 100% | Jumbo frames help efficiency only when every device on the path agrees. |
| Camera/NVR VLAN uplink | 1G | 60% to 90% | Many steady streams can make burst buffer more useful than raw average load. |
| L3 Payload | Untagged Wire Efficiency | 802.1Q Wire Efficiency | QinQ Wire Efficiency |
|---|---|---|---|
| 64 bytes | 62.7% | 60.4% | 58.2% |
| 256 bytes | 87.1% | 85.9% | 84.8% |
| 512 bytes | 93.1% | 92.4% | 91.8% |
| 1500 bytes | 97.5% | 97.2% | 96.9% |
| 9000 bytes | 99.4% | 99.3% | 99.3% |
With the best of intentions, you set up that shiny new switch. Your goal was to have clean VLAN segregation between your Wi-Fi, NAS, and that other network… your guest network. Everything seems good on paper. Then you turn it loose and push some traffic through it. All of a sudden, your home lab router has its knickers in a knot. Lights is blinking like crazy, yet nothing is getting through.
Often it’s not because of your hardware. More often then not, it’s because you didn’t remember to solve for “x” before hitting enter. 1Q tags are such a rounding error in a spreadsheet, they’re practically invisible. In isolation, they’re trivial. But when you scale them out into hundreds or even thousands of little packet per second, you begin to see how that tiny overhead adds up. The calculator above will do the math for you and remove the guesswork so you know exactly what kind of wire rate you’ll need to achieve with your particular configuration.
How to Calculate Network Overhead
The link speed gets most of the attention. Everyone goes out and buys that ten gigabit card because, hey! That’s fast. It ain’t about speed. It’s about efficiency. Every single packet incurs an overhead known as ethernet framing. Whether the packet contains a single byte of data or a huge chunk of some video file, you still pay the fee. The smaller your average packet, the bigger share of available bandwidth it will consume. And that’s before accounting for other overheads.
And if you’re running any high-traffic routing protocols, camera feeds, or VoIP streams, then the classic small packet penalty is eating you alive. In fact, if you’re running one of those router-on-a-stick configurations, where each VLAN runs across the same physical port, then you’re essentially paying this framing tax twice per routed packet: once going in, and again coming back out.
On this page you can change the typical amount of data carried in each packet (downsize them) and notice the loss of efficiency. Turn off the tagging of the actual traffic by toggling it down to zero. In most cases, almost all the traffic through a trunk port is tagged. Other mixed networks has a large percentage of native VLAN traffic. The reference table on the page explain this clearly. We see that a standard 1500-byte payload fits nicely inside the 1522-byte frame limit. Add a second QinQ tag and it exceeds the limit. You’ll need to upgrade your switch profile to avoid breaking that limit.
This finally leads us to the MTU mismatch. You can easily configure your server’s jumbo frame size and forget about it without realizing that your edge switch may still have a legacy 1518-byte acceptance limit. Your applications will see timeout/retries if your switch drops those oversized frames. This looks exactly like congestion. It looks exactly like congestion, but it is actualy fragmentation. It’s fragmentation. And with the calculator, you can visually see the headroom. You’ll know how much space there is between your chosen frame size, the MAC headers and tags, and the inter-frame gaps required by Ethernet in order to function physically.
Overhead doesn’t dissapears just because you have faster links. That 25 gigabit aggregation switch is using the same four byte tag structure that the gigabit access switch did. It will waste exactly the same absolute number of bytes. The overhead might be a much lower percentage of the total pie, but it’s still there. Why do folks need to go to 10G or 25G? Because they’re diluting the cost of that overhead by moving up the throughput ceiling. It does not change the physics of Ethernet.
But if your workload is all small packets, then even a 100G link feels constrained when the packet processing overhead swamps the switchs internal buffers. But this also means planning for burst traffic in addition to sustained loads. The reality is, networks aren’t smooth streams. They’re jagged spikes. One camera event or an unscheduled backup job can spike a link for a few milliseconds. That’s where the buffer comes into play. An engineering buffer of ten or fifteen percent provides the switch with breathing room to absorb the spikes and not drop any packets. That’s the difference between a system that stutters under load and one that is invisible.
We’re not aiming for maximum optimization of each and every byte. That’s a fool’s errand. We’re looking to understand the trade offs. Does bigger mean better, with bigger frames in exchange for compatibility along the whole path? Does more mean better, with more segmentation, security, and clear management in exchange for extra routing overhead? There isn’t one right answer here. But there sure as hell are some wrong answers.
The right answer is knowing just what it is that’s going down your trunk before you lock things into place. You shouldn’t of wanted your network to be a bottleneck; you want your network to be a reliable channel. Let the math tell you what hardware to buy. Respect those frame limits, start with the numbers, and let the math guide your hand.