VSWR Mismatch Uncertainty Calculator
Estimate reflection coefficient, return loss, mismatch loss, source-load interaction uncertainty, and delivered RF power range for home lab radios, coax runs, antennas, power meters, and VNA checks.
Formula Breakdown
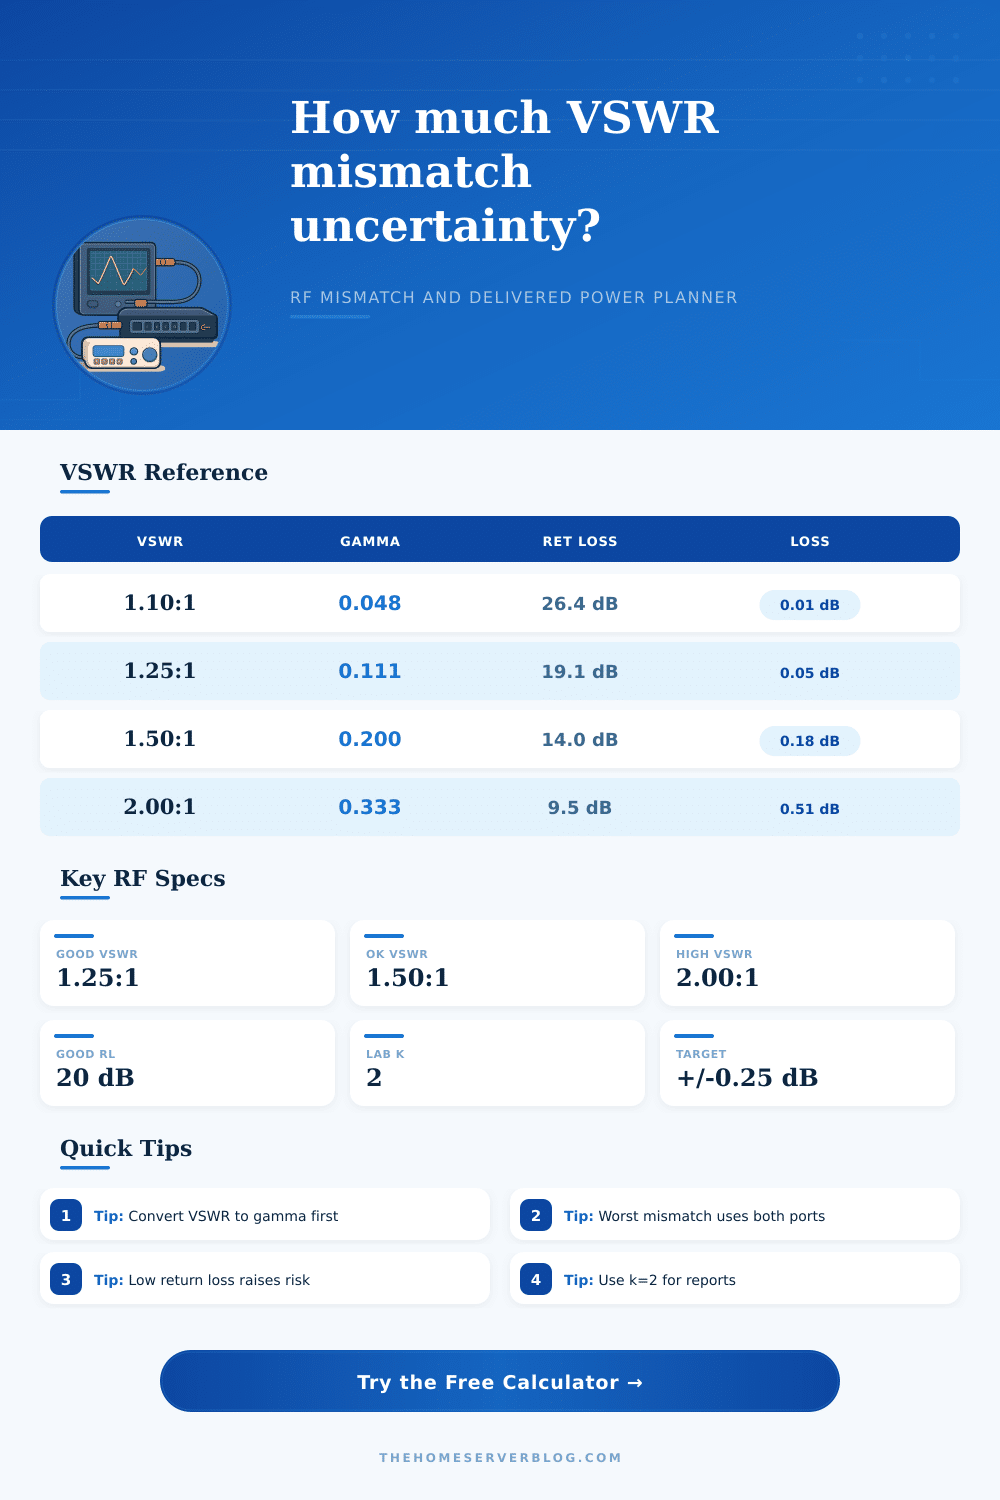
| VSWR | Reflection coefficient | Return loss | Mismatch loss |
|---|---|---|---|
| 1.05:1 | 0.0244 | 32.3 dB | 0.003 dB |
| 1.10:1 | 0.0476 | 26.4 dB | 0.010 dB |
| 1.25:1 | 0.1111 | 19.1 dB | 0.054 dB |
| 1.50:1 | 0.2000 | 14.0 dB | 0.177 dB |
| 2.00:1 | 0.3333 | 9.5 dB | 0.512 dB |
| 3.00:1 | 0.5000 | 6.0 dB | 1.249 dB |
| Configuration | Primary mismatch pair | Typical target | Planning note |
|---|---|---|---|
| Transmitter to antenna | Radio output and antenna system | VSWR under 1.5:1 | Mismatch loss reduces delivered power and may trigger foldback on some radios. |
| VNA source to DUT | VNA port and DUT input | Port match under -20 dB | Adapter return loss can dominate a small gain or loss measurement. |
| Power meter through coupler | Coupler output and sensor input | Sensor RL over 20 dB | Use the sensor and coupler match when reporting sampled power uncertainty. |
| Receiver calibration | Source output and receiver input | Pad improves match | A fixed attenuator can reduce mismatch interaction even if it adds known loss. |
| Filter passband test | Source port and filter input | Good return loss near passband | Ripple may appear as uncertainty when both ports have imperfect match. |
| Uncertainty contributor | How it enters | Distribution used here | Practical control |
|---|---|---|---|
| Mismatch interaction | 20 log10(1 +/- gamma source gamma load) | Half-width as rectangular | Improve return loss or add attenuation between ports. |
| Instrument amplitude accuracy | User-entered plus/minus dB | Rectangular | Use current calibration data and stable source levels. |
| Cable and fixture uncertainty | Estimated from insertion loss | Rectangular | Characterize coax loss at frequency and avoid bending changes. |
| Connector repeatability | User-entered plus/minus dB | Rectangular | Clean connectors, use proper torque, and limit reconnect cycles. |
| Design buffer | Multiplier on uncertainty terms | Planning allowance | Increase in field work or when adapter specs are unknown. |
| Project size | Likely VSWR range | Useful result | Secondary check |
|---|---|---|---|
| Wi-Fi AP antenna swap | 1.2:1 to 1.8:1 | Mismatch loss and delivered power change | Connector adapter VSWR and pigtail movement |
| LoRa roof gateway | 1.3:1 to 2.0:1 | TX power delivered after coax and antenna match | 915 MHz coax loss and lightning arrestor match |
| HF bench load test | 1.0:1 to 1.2:1 | Low uncertainty reference for transmitter power | Load heating and meter calibration interval |
| VNA adapter chain | 1.1:1 to 1.5:1 | Adapter mismatch effect on S-parameter reading | Port extension, calibration plane, and torque |
| Bridge dish alignment | 1.3:1 to 2.0:1 | Delivered RF power range into feed or radio | Frequency-specific connector and cable return loss |
This calculator is an RF planning aid. Final uncertainty statements should use calibrated instrument data, known connector condition, measured fixture loss, and any lab-specific reporting requirements.
When you measure RF power with an instrument in either a laboratory or field environments, the displayed value of the RF power dont necessarily indicates the actual power that reaches the load. Due to the fact that the RF source and load do not often have an exact match, the actual power that reach the load can vary by several tenths of a decibel from the value that the RF power meter indicates. This type of uncertainty is referred to as mismatch uncertainty and becomes apparent when comparing RF power measurements taken at different times or with different types of connector within the RF chain.
Mismatch uncertainty can be difficult to see because this factor causes a quite small loss. For instance, a standing wave ratio of 1.5:1 indicates a loss of approximately 0.18 dB. However, the ratio of 1.5:1 between the reflected and incident wave can introduces a change in RF power of 0.5 dB or more.
How mismatch affects RF power readings
You can perform these types of calculations with a calculator if the two VSWR values, the forward power level, and the cable loss between the RF source and load are provide. The calculator will provide the nominal delivered RF power to the load and the range of RF power values that can be caused by mismatch uncertainty. For many who work with RF power meters, the uncertainty caused by the mismatch between the RF source and load is noticed when the meter do not display the same reading for the same measurement.
The meter might have identical connections, utilize the same RF source, and have the same load, yet the RF power level will drift. The relationship between the source and load match causes this drifting of the value. Should you alter either of the connections, the value of the reflection coefficient that the load experiences from the source will change.
By entering the return loss of the fixture and the VSWR of the connector that is changed into the calculator, that alteration will increase the effective source gamma. An increase in the effective gamma of the source will lead to a widening of the uncertainty window. The coverage factor that is used in the calculation is also important to consider.
One often selects a coverage factor of two to indicate the uncertainty with 95% confidence in the measurement. A coverage factor of one indicates the raw standard uncertainty in the measurement. The calculator will apply the coverage factor after it calculates the root-sum-square of the mismatch uncertainty, instrument accuracy, cable uncertainty, and repeatability of the measurement.
Thus, the expanded uncertainty that the calculator provides includes the buffer that was selected for that uncertainty window. This buffer can be used to account for the fact that the RF circuit will differ between the laboratory and the field, for instance, or that the connectors have experienced heavy use. While the uncertainty of a systems VSWR is a value that you may require to remain within a certain range with respect to your specific application, a 1.8 to 1 VSWR value with a poor source match will not be acceptable for a system like a receiver, but it may be acceptable for a transmitter that is feeding an antenna with fold-back protection.
The calculator helps to display the difference between these scenarios. One way to manage the uncertainty introduced by a mismatch in your system is to improve the source match rather than the load match. Placing an attenuator near the RF source will reduce the effective gamma of the source, thereby reducing the uncertainty of the system.
The calculator can show the difference between lowering the value of the source VSWR and increasing the cable loss. Introducing an attenuator will often lead to a tighter range of delivered power to the load. It is also possible to treat the return loss of the fixture into which the cable leads as a variable.
Simply moving the cable often changes the effective match of the cable, which can be several decibels. Therefore, it is possible to run the calculation twice to determine the effect of the fixture return loss. Once with the best fixture return loss measurement, and once with a return loss several decibels worse than the best measurement.
The tables provided on this page are a quick visual aid to understanding the relationship between VSWR, reflection coefficient, return loss, and mismatch loss. These tables allow for a quick understanding of whether or not the VSWR measurement of, for instance, 1.35 to 1 represent a system requiring further improvements. The tables make clear that system mismatches are manageable within the normal VSWR range of less than 2 to 1, but that the uncertainty and mismatch loss begin to increase rapidly once the VSWR reaches 2 to 1.
The goal of these calculators and tables is to allow for a specific understanding of the VSWR of the systems being measured, and for what reason it may or may not require adjustments. The goal is not to achieve a VSWR that approaches 0 (or complete uncertainty), which is impossible to achieve. Instead, the uncertainty of the VSWR allows for an explanation as to why two measurements of RF power may differ by 0.4 dB, for example.
These calculators provide the numbers necessary to provide such an explanation regarding the specific equipment that is present in the RF path.