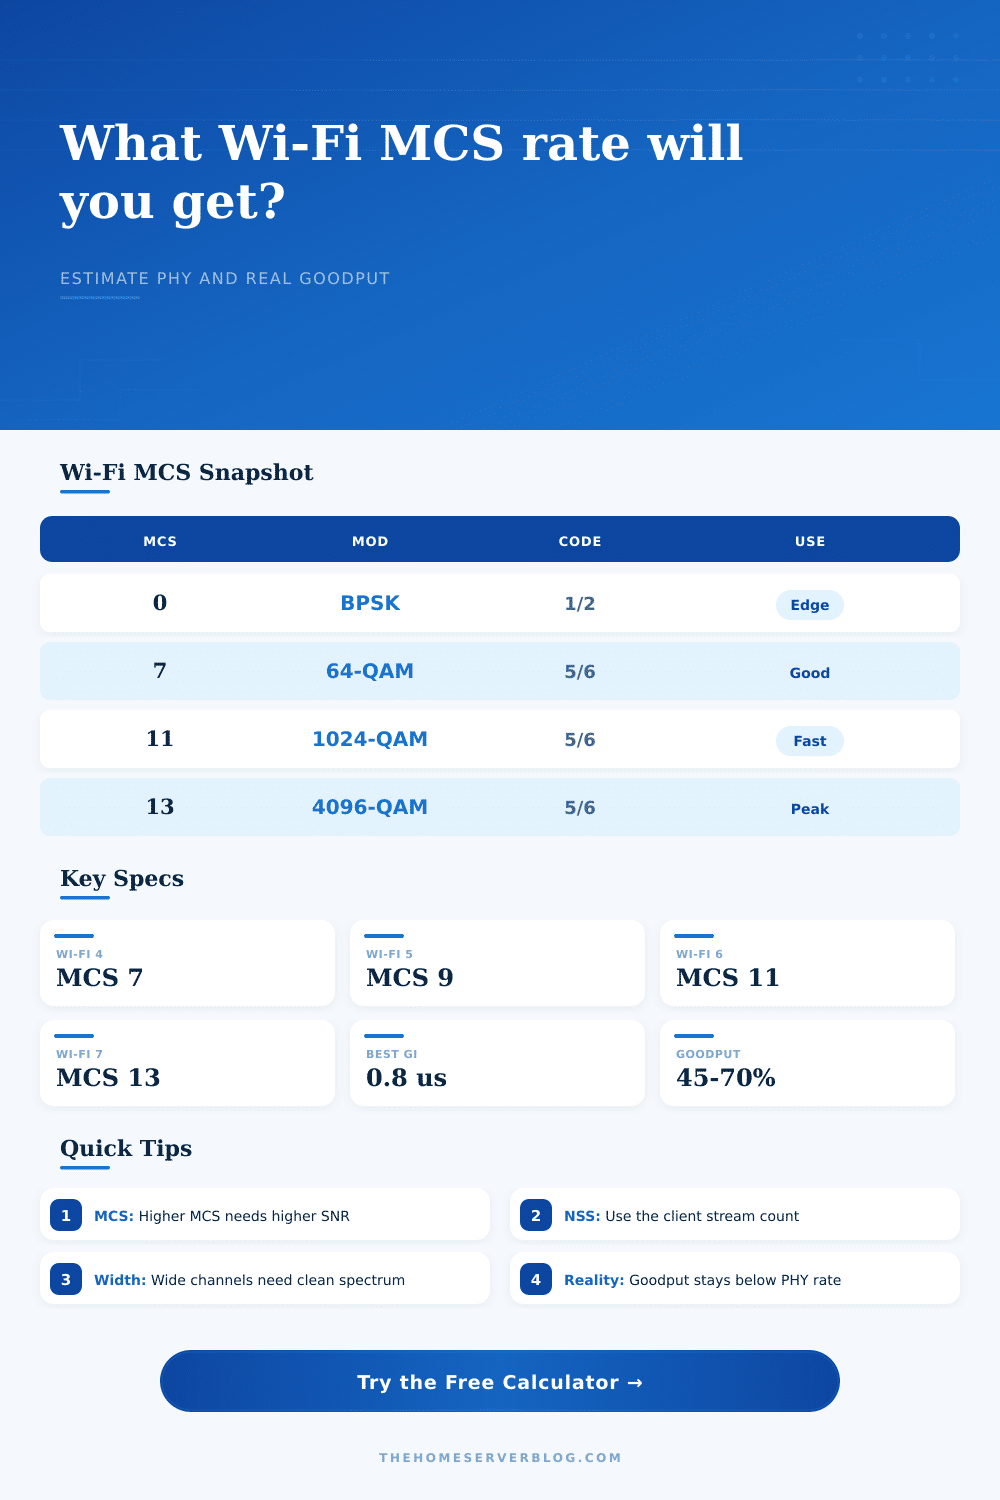
Wi-Fi MCS Data Rate Calculator
Estimate PHY data rate, usable goodput, per-client share, and airtime load from Wi-Fi standard, MCS index, channel width, spatial streams, guard interval, modulation, coding rate, band, client count, and airtime efficiency.
| MCS | Modulation | Coding rate | Bits per carrier | Planning note |
|---|---|---|---|---|
| 0 | BPSK | 1/2 | 0.5 | Very robust edge-rate operation and management-heavy links. |
| 1-2 | QPSK | 1/2 to 3/4 | 1.0 to 1.5 | Low to moderate SNR, IoT, distance, or obstructed rooms. |
| 3-4 | 16-QAM | 1/2 to 3/4 | 2.0 to 3.0 | Usable mid-rate links where signal is stable but not excellent. |
| 5-7 | 64-QAM | 2/3 to 5/6 | 4.0 to 5.0 | Common healthy Wi-Fi 4 and medium-quality Wi-Fi 5 or 6 clients. |
| 8-9 | 256-QAM | 3/4 to 5/6 | 6.0 to 6.67 | Good 5 GHz or 6 GHz links with low retry rates. |
| 10-11 | 1024-QAM | 3/4 to 5/6 | 7.5 to 8.33 | Wi-Fi 6 peak operation near the AP with strong SNR. |
| 12-13 | 4096-QAM | 3/4 to 5/6 | 9.0 to 10.0 | Wi-Fi 7 high-rate links in very clean close-range conditions. |
| Mode | 20 MHz | 40 MHz | 80 MHz | 160 / 320 MHz |
|---|---|---|---|---|
| Wi-Fi 4 MCS 7, 0.4 us GI | 72.2 Mbps | 150 Mbps | Not used | Not used |
| Wi-Fi 5 MCS 9, 0.4 us GI | 96.3 Mbps | 200 Mbps | 433.3 Mbps | 866.7 Mbps at 160 |
| Wi-Fi 6 MCS 11, 0.8 us GI | 143.4 Mbps | 286.8 Mbps | 600.5 Mbps | 1201 Mbps at 160 |
| Wi-Fi 7 MCS 13, 0.8 us GI | 172.1 Mbps | 344.1 Mbps | 720.6 Mbps | 2882 Mbps at 320 |
| Input | Applies to | Rate effect | When to use |
|---|---|---|---|
| 0.4 us GI | Wi-Fi 4 and 5 | Shorter symbol time, higher PHY | Clean links with low delay spread. |
| 0.8 us GI | All modern modes | Default HE/EHT high-rate case | Most Wi-Fi 6, 6E, and 7 calculators use this baseline. |
| 1.6 us GI | Wi-Fi 6 and 7 | Lower PHY than 0.8 us | Outdoor, mesh, or more reflective spaces. |
| 3.2 us GI | Wi-Fi 6 and 7 | Most conservative PHY | Longer-range or difficult RF environments. |
| 320 MHz width | Wi-Fi 7 | Double 160 MHz rates | Mainly clean 6 GHz channels near the AP. |
| Scenario | Likely MCS range | Goodput factor | What to watch |
|---|---|---|---|
| 2.4 GHz mixed IoT | MCS 0-5 | 30% to 50% | Bluetooth, neighboring APs, legacy clients, and retries. |
| 5 GHz same-room client | MCS 8-11 | 50% to 70% | Client stream count and AP channel utilization. |
| 6 GHz clean room | MCS 10-13 | 55% to 75% | Distance and wall loss can drop MCS quickly. |
| Outdoor mesh | MCS 4-8 | 30% to 55% | Guard interval, reflections, weatherproof enclosures, and alignment. |
| Dense guest SSID | MCS 5-9 | 35% to 55% | Airtime fairness, beacon load, and low-rate clients. |
Probably the most familiar number stamped onto your router box is the one in the heading. That’s the possible maximum of physical link from your device to access point, the PHY rate. It presumes ideal conditions: no interference at all. Not only does it tell you nothing about how much internet you’ll see, it’s pretty much just gibberish when you’re trying to plan out your real-world internet usage.
What counts is the goodput. That’s the amount of useful data that gets through after the network stack remove headers and deals with acknowledgments and such. The network also has to wait for clear channel assessments and retry dropped packets. In some cases, the gap is stunning. Real world throughput plummets to as low as half the stated rate.
Why Real Speed Is Slower Than Advertised
If you don’t know why that happens, then you won’t build an effective network. What’s underneath the hood is called the modulation and coding scheme, or MCS. It represent how closely the radio will pack its data onto the signal carrier. Complex modulation schemes (such as 4096-QAM or 1024-QAM) is used for higher MCS indices. They get more symbols per bit by squeezing more bits into each symbol. That comes at a price… High order modulations need good signal-to-noise ratios.
An MCS 11 link crashes down to MCS 5 if there’s a microwave oven or even just a wall in the way. Suddenly your capacity have halved. Knowing where your clients fit in that hierarchy is critical. Once you plug in your channel width and number of spatial streams, the calculator above do the rest. It spares you from the guesswork about the number of subcarriers or their symbol timing. It turns these abstract radio numbers into a concrete estimate of what your users will experience.
Another lever pulled too soon is channel width. A wider channel has twice the data rate. This means it has twice as much bandwidth, if you are doubling from say twenty megahertz to forty. But it has double the vulnerability to interference. In an apartment building, for example, a wide channel means devices talking across each other. Narrow channels are tougher. They is less subject to noise. Hang around at higher MCS indices longer.
The table on page makes this clear. Wi-Fi 6 and 7 differ in their guard intervals. Longer guard interval mean the signal gets a little breathing room in an environment where there’s a lot of echoes. Yes, it slows down the raw speed a bit. But headline numbers aren’t what matter here.
Most hardware marketing gets it wrong when it comes to spatial streams. Yes, the access point may have four antennas. But your phone probably just has two. The link speed is whatever the weaker side negotiate. Designing capacity by looking at the AP spec will get you disappointed. You need to model the client.
Is it a cheap smart plug or a high-end laptop? The latter will negotiate multiple streams and high MCS. The former will stick to MCS 0 or 1. Those devices hog airtime and drag down others. That’s what makes dense networks so taxing: the hidden tax. The calculator visualizes that drag. It lets you dial in number of active clients and airtime efficiency. It shows you how many megs each slow device steals from everybody else.
So what’s the connection? This is called airtime fairness. Wi-Fi is a half-duplex medium. One device talks at a time. If a slow client is sending at ten megabits per second, it’ll take him ten times as long to get a file across compared to a fast client sending at one hundred. So he’s taking up ten times the amount of airtime. Slow clients monopolize more airtime. The network doesn’t care how fast or slow they are, only how much time they’re using. Throw a few slow IoT devices into your mix and those streaming video clients will start stuttering.
You can put in a channel busy penalty and make the tool emulate that noise. It makes you confront reality of shared spectrum.
So yeah, Wi-Fi planning is not about maximizing the PHY rate. Wi-Fi planning is all about airtime management.
How high of an MCS index can I have without blowing up? That’s what matters. How high of an MCS index can I have while still having no dropped connections? That’s what you’re going for.
How wide do I need to get things moving? But how wide do I go before it drowns out my data?
How many streams do I need to serve clients? But how many do I buy if they can’t even use them?
The engineering happens when there’s a gap between the advertised speed and real speed. And closing that gap is the path to turning a flashing light on your router into a working connection. Signal isn’t the same as data. Knowing the differance is everything.